
Layer 01
Strategy intelligence
Assess individual strategies through structured performance, consistency and behavioural metrics — so the picture of a strategy is more than one summary number.
Strategy intelligence. Better portfolios.
SIPS brings strategy analysis, portfolio construction, robustness testing, trade-distribution analysis and decision reporting into one structured platform — so portfolio choices are made with context, not on a single backtest.
Workspace
Portfolio overview
Illustrative dataStrategies indexed
1,248
In workspace library
Portfolio candidates
32
Awaiting comparison
Robustness runs
14
4 queued
Health index
76/100
Composite, illustrative
Simulated portfolio path
CandidateReference
Portfolio health
IllustrativePortfolio candidates
Illustrative data| Candidate | Strategies | Corr. avg | Score | State |
|---|---|---|---|---|
| Candidate 12 | 18 | 0.14 | 96 | Active |
| Candidate 08 | 14 | 0.21 | 93 | Active |
| Candidate 03 | 22 | 0.27 | 90 | Active |
| Candidate 06 | 11 | 0.33 | 88 | Draft |
Assemble portfolio candidates from your strategy library under controlled rules.
Structured quality, consistency and behaviour metrics for every strategy.
Simulate outcome ranges instead of relying on one historical path.
See how activity spreads across strategies, instruments and time.
A composite read on stability, diversity, correlation and depth.
Comparison reports built to support a portfolio decision, not decorate it.
Built for serious strategy development
SIPS is a set of analytical tools for building and comparing strategy portfolios. Prop-firm workflows are one supported use case among several, not the whole product.
What SIPS does
SIPS brings strategy evaluation, portfolio construction and robustness analysis together within one structured decision process.
Layer 01
Assess individual strategies through structured performance, consistency and behavioural metrics — so the picture of a strategy is more than one summary number.
Layer 02
Understand how strategies interact when combined, rather than judging each strategy only in isolation. Interaction is where portfolio behaviour actually comes from.
Layer 03
Use simulation and stress testing to explore uncertainty, drawdown ranges and portfolio resilience across many possible paths.
Layer 04
Analyse how trading activity is distributed across strategies, instruments and time within the portfolio — and where activity concentrates without anyone intending it to.
Layer 05
Compare strategies and portfolios through structured reports designed to support a decision and leave a record of why it was made.
The SIPS workflow
A repeatable four-stage process. Each stage narrows the field with evidence rather than preference.
01
Bring strategy and trade data into one structured environment with consistent metadata.
02
Evaluate quality, behaviour, consistency and portfolio fit across the library.
03
Assess correlation, robustness, distribution and how candidates interact under stress.
04
Create and compare portfolio candidates through a controlled, documented workflow.
Portfolio intelligence
Portfolio decisions need context that individual strategy metrics cannot provide. Two strong strategies can be a weak pair. SIPS reads strategy quality, diversification, behaviour, robustness and trade distribution together, so a candidate is judged as a portfolio rather than as a stack of separate results.
Correlation in context. Pairwise and portfolio-level relationships, not a single average.
Behaviour classification. Group strategies by how they actually behave, not by label.
Composite health. One readable indicator backed by its component scores.
Correlation matrix
Composition
Score breakdown
Composite76/100
Behaviour mix
4 groups
Avg. correlation
0.21
Health state
Balanced
Monte Carlo & robustness
A backtest is one path out of many that could have happened. SIPS resamples and simulates to show the range of possible outcomes, how deep drawdowns tend to run, and how much of the result depends on sequence rather than edge.
Confidence bands. See where outcomes cluster and where the tails sit.
Drawdown ranges. Plan around a distribution rather than a single worst case.
Scenario paths. Compare candidates on stability of outcome, not headline result.
Simulated outcome range
MedianSample paths
Outcome distribution
Drawdown range
Trade distribution engine
Headline metrics hide where the activity comes from. A portfolio can look diversified while three strategies produce most of its trades, or while exposure clusters into a single session. The distribution engine exposes that shape across strategies, instruments and time.
Contribution. Which strategies drive the portfolio's trade count and exposure.
Timing. How activity spreads across sessions, days and market conditions.
Concentration. Flags where a portfolio depends more narrowly than it appears to.
Strategy contribution
Share of tradesTrade frequency by session
Instruments
9
Top-3 share
49%
Concentration
Moderate
Platform capabilities
Every stage of the process has a dedicated tool, and each one writes into the same workspace.
Rank and filter a library against portfolio-aware criteria.
Put candidates side by side on the same measures.
Composite indicator backed by readable component scores.
Work across whole sets of portfolios, not one at a time.
Classify strategies by how they trade, not what they're called.
Pairwise and portfolio-level relationships over time.
Outcome ranges, drawdown bands and scenario paths.
Where trades come from, and where they concentrate.
Structured output that records the reasoning behind a choice.
The SIPS member platform
Your strategies, portfolio tools, analysis and reports — together in one structured workspace, with the same design language as the rest of SIPS.
Portfolios
32
Strategies
1,248
Reports
57
Recent strategies
Illustrative| Strategy | Behaviour | Score | State |
|---|---|---|---|
| Strategy 041 | Trend | 91 | Indexed |
| Strategy 118 | Mean rev. | 87 | Indexed |
| Strategy 073 | Breakout | 84 | Review |
| Strategy 026 | Range | 80 | Review |
SIPS Insights
Written for people building systematic strategies and deciding what belongs in a portfolio.
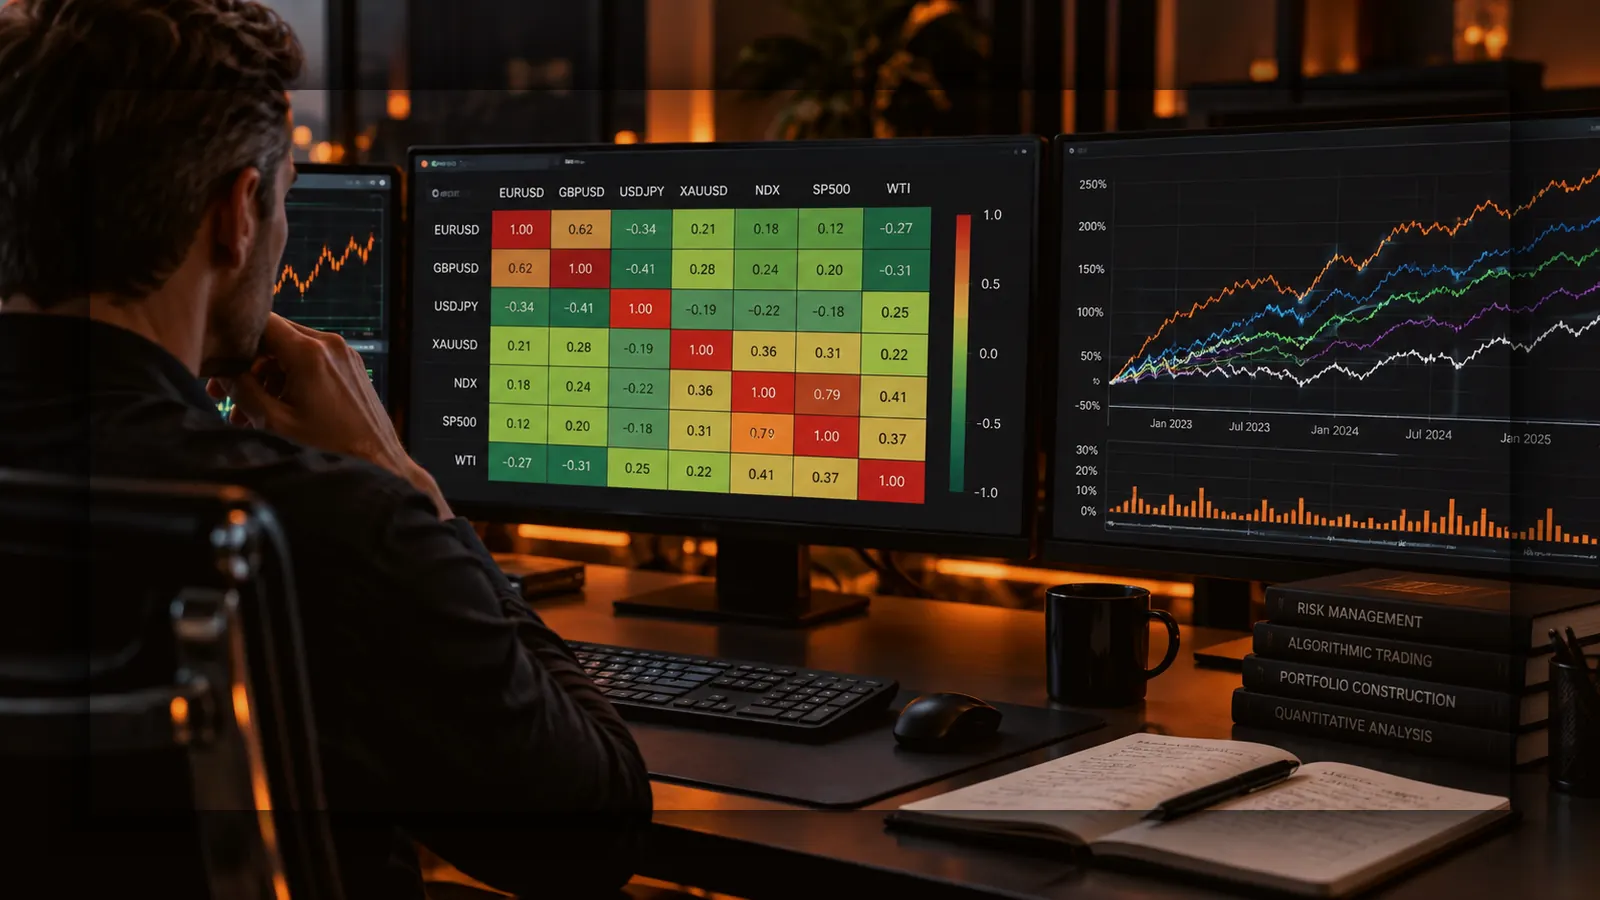
Diversification & Correlation
Low historical correlation is genuinely useful information. It is not a guarantee, and it is not the same thing as understanding why two strategies behave differently.
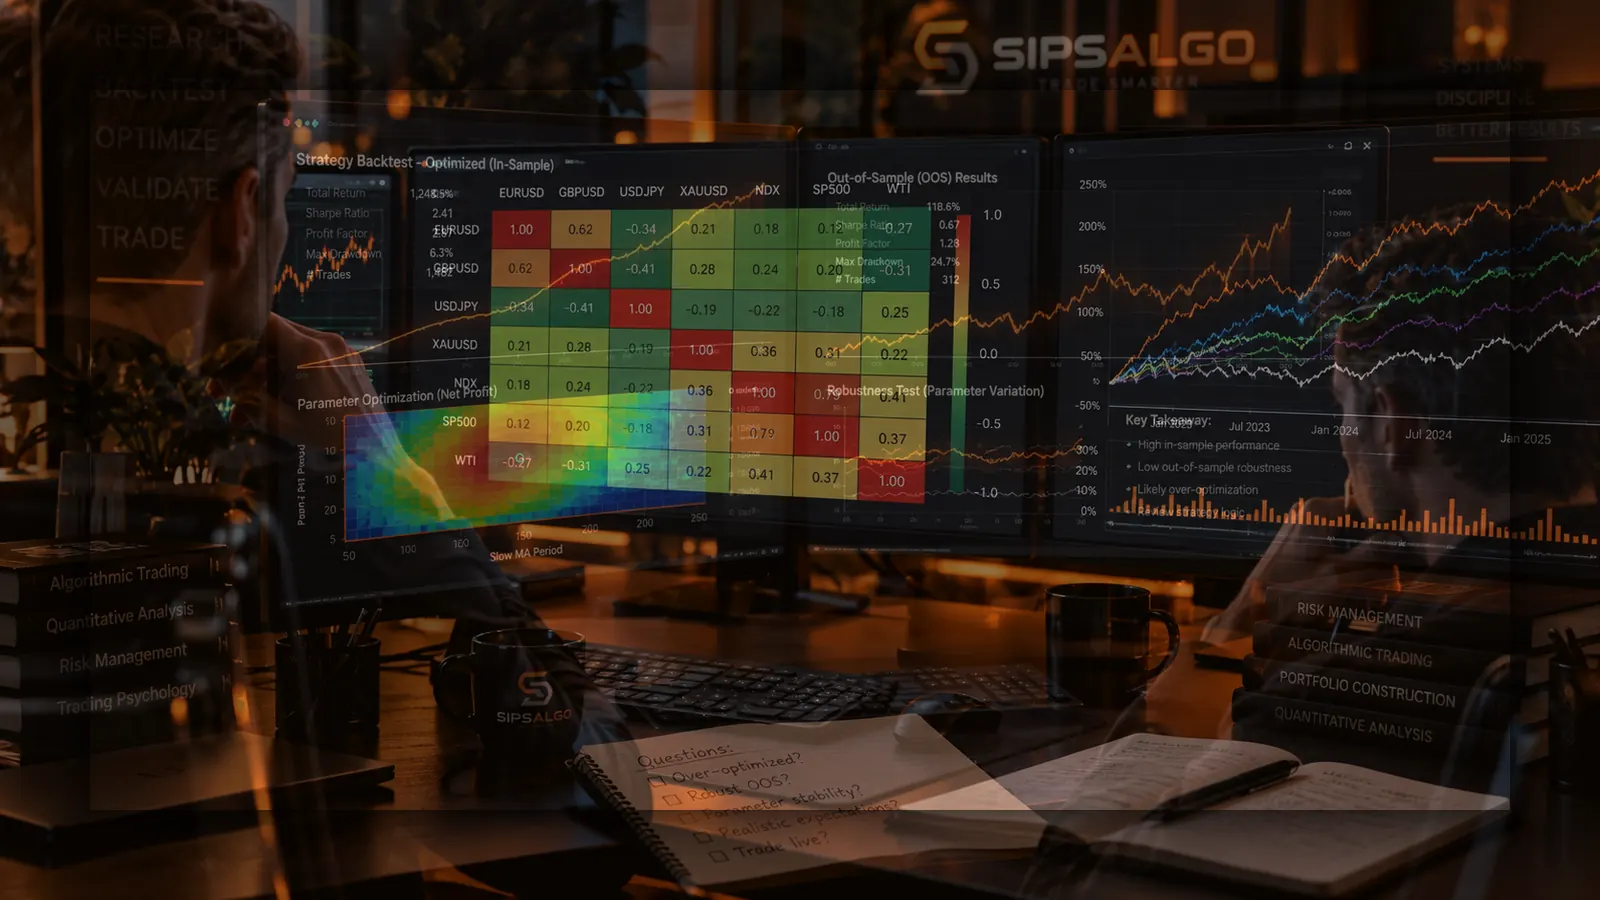
Backtesting & Robustness
A historical backtest shows one sequence of trades that actually happened. Monte Carlo simulation reshuffles that evidence to show a plausible range of outcomes.
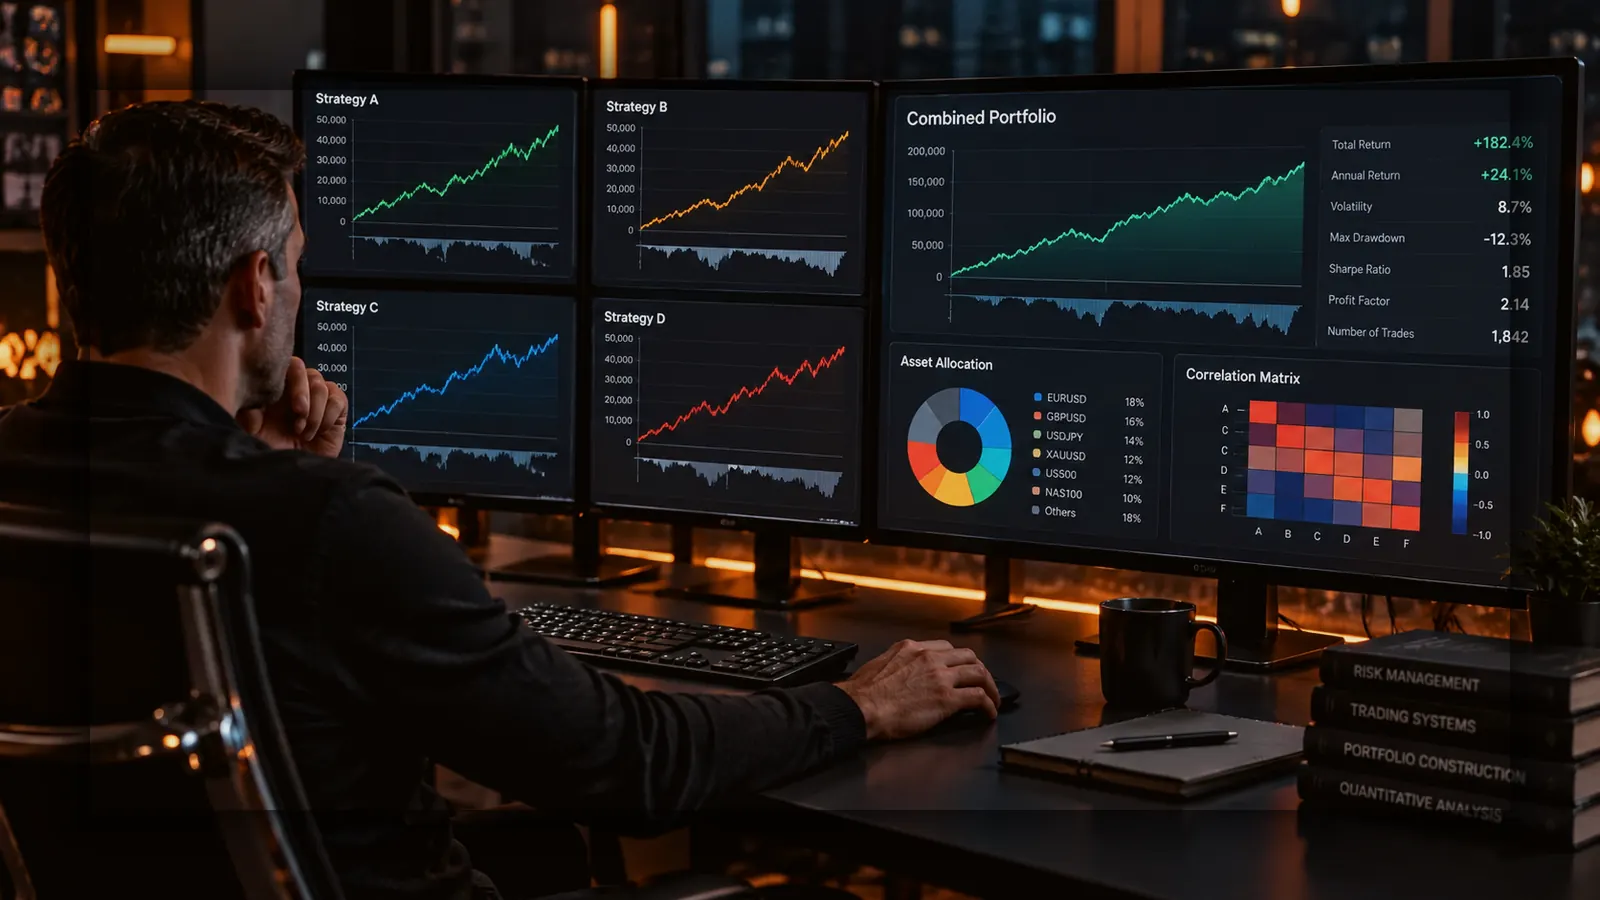
Portfolio Trading
A strategy can pass every individual test and still be a poor addition to a specific portfolio. Why strong backtests don't automatically combine into a well-diversified result — and what to check instead.
Get started
Bring strategy analysis, robustness testing and portfolio intelligence into one structured workflow.
Software and risk notice. SIPSALGO provides software tools for strategy and portfolio analysis. Trading and investment decisions involve risk, and analytical tools cannot guarantee future performance. Nothing on this page is financial advice or a recommendation to trade.